Trends & Analytics
The Trends page at /trends provides aggregate analytics across all your analyses over time. Use it to identify patterns, track quality improvements, and monitor detection rates.
Daily Data
The main chart shows daily analysis data with two view modes:
- Count mode — Absolute number of issues detected per day
- Rate % mode — Detection rate as a percentage (issues / total turns analyzed)
Toggle between modes using the chart controls.
Time Range
Select a time range to view:
- 7 days — Recent week
- 30 days — Default view, past month
- 90 days — Past quarter
The API supports custom ranges from 1 to 365 days.
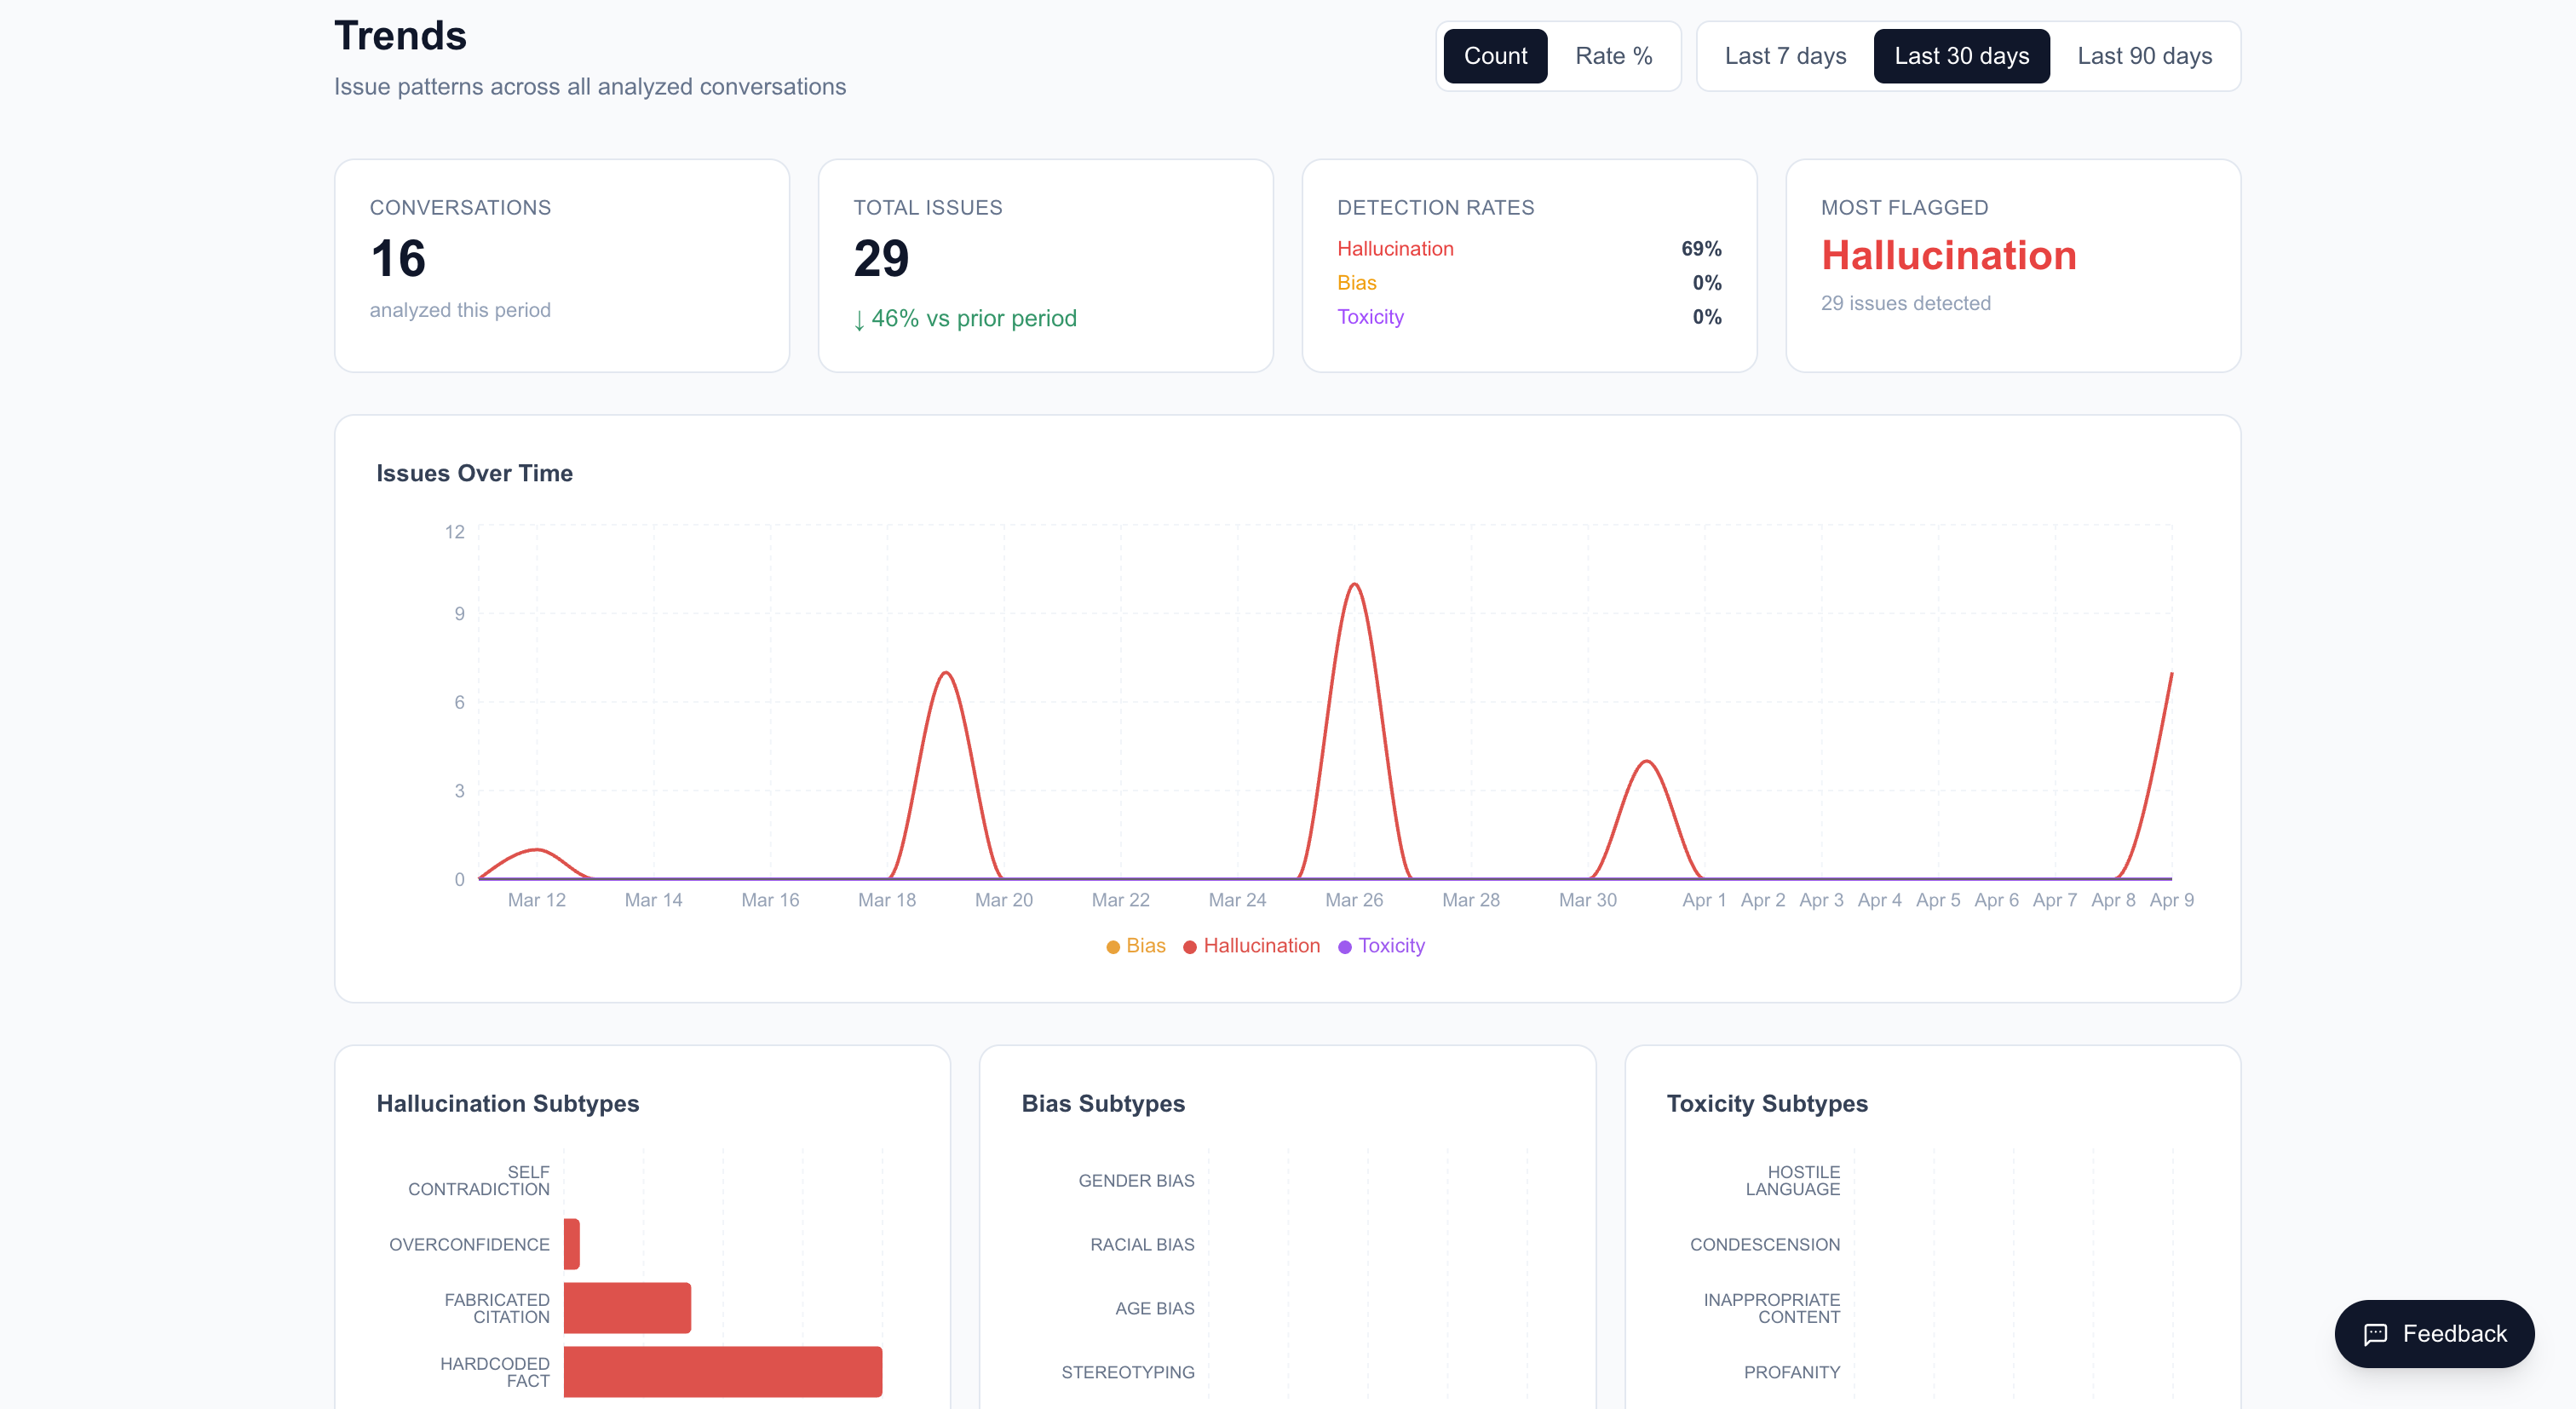
KPI Cards
At the top of the page, summary cards show:
- Total uploads in the selected period
- Total issues detected
- Detection rates by category (hallucination, bias, toxicity)
- Comparison with the prior period (e.g., if viewing 30 days, compares with the previous 30 days)
Subtype Breakdown
Three bar charts show the distribution of issue subtypes:
Hallucination subtypes:
- Self-Contradiction
- Overconfidence
- Fabricated Citation
- Hardcoded Fact
Bias subtypes:
- Gender Bias
- Racial Bias
- Age Bias
- Stereotyping
Toxicity subtypes:
- Hostile Language
- Condescension
- Inappropriate Content
- Profanity
Data Sources
Trends include data from both:
- File uploads — Conversations uploaded via
/upload - Chat sessions — Live chatbot conversations that were analyzed after completion